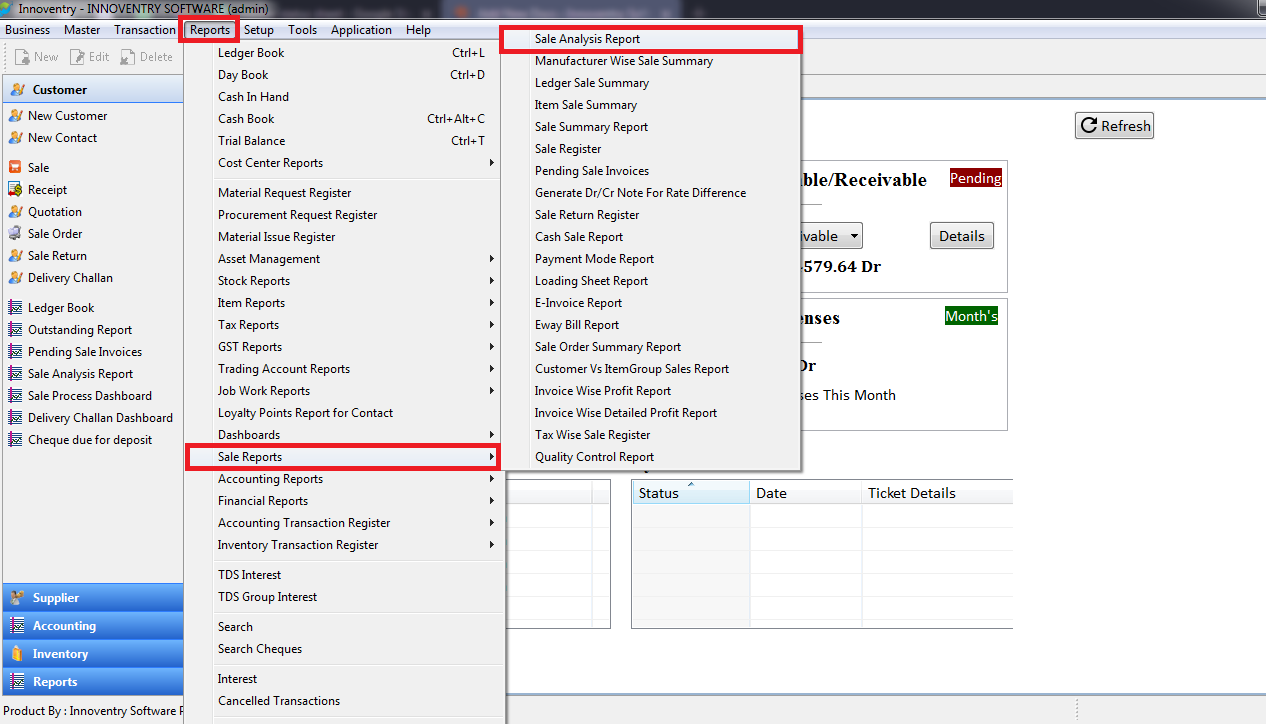
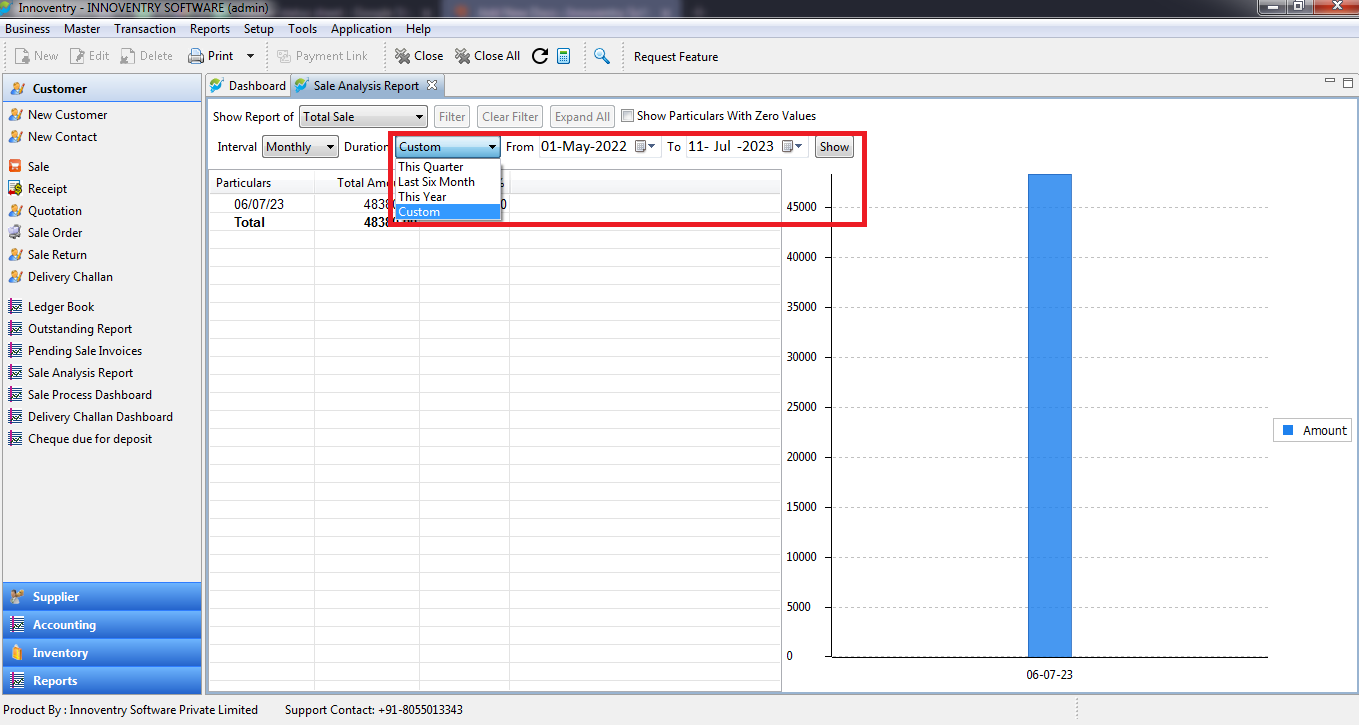
Go to Reports -> Sale Reports -> Sale Analysis Report.
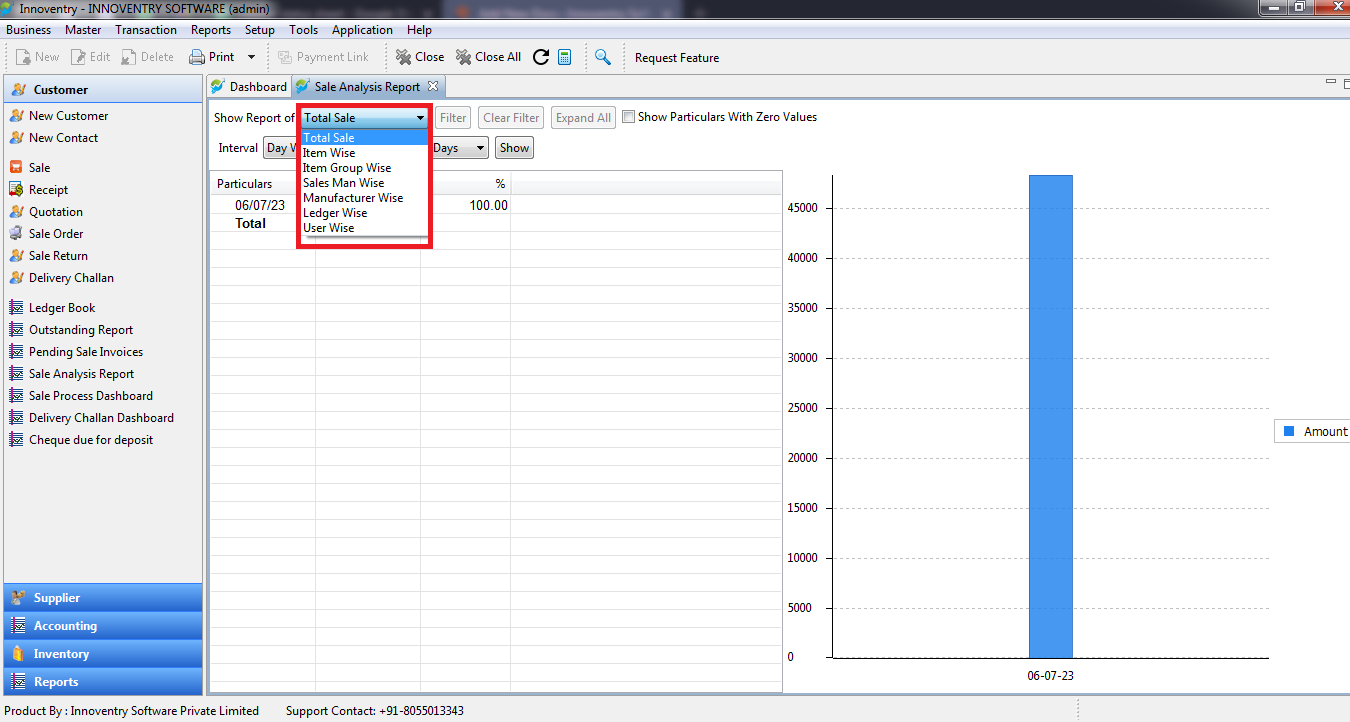
In this report you can analyze sales based on Item Wise, Item Group Wise, Salesman Wise, Manufacturer Wise, Ledger Wise, User Wise Total Sales.
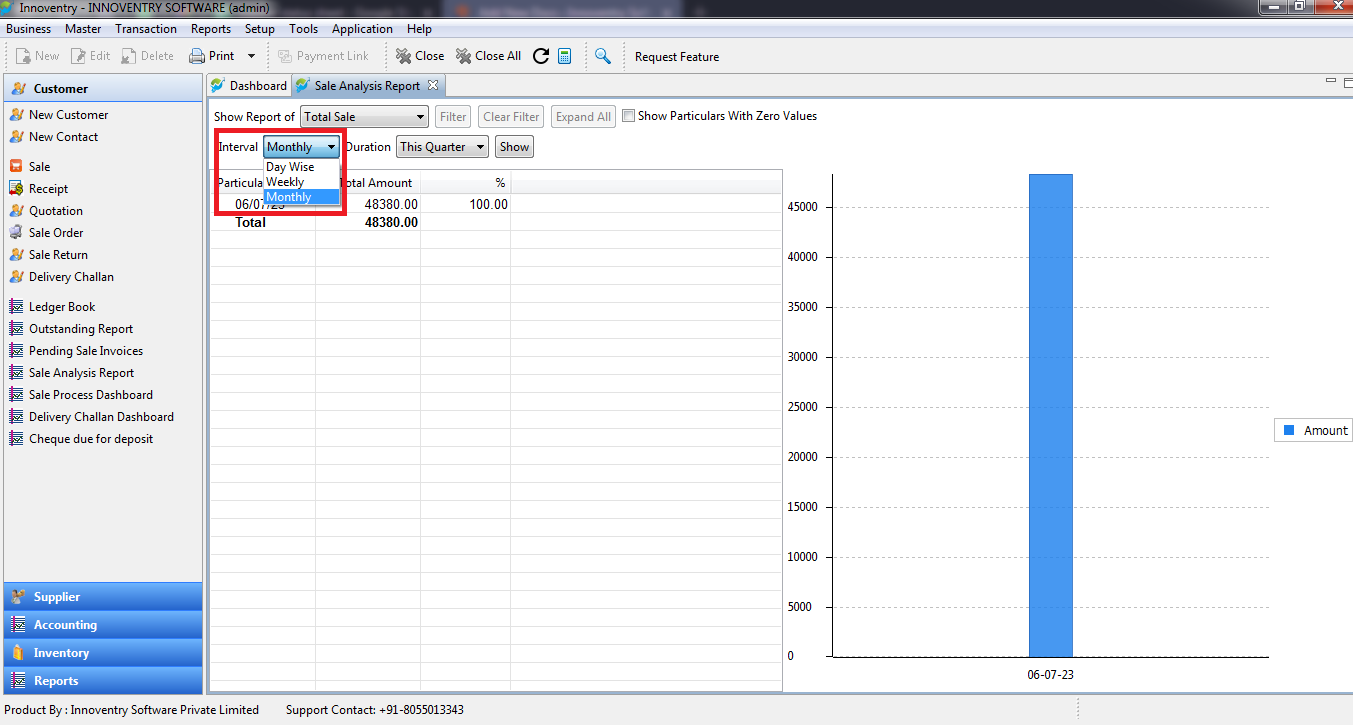
- You can analyze sale using Intervals like Day wise, Weekly or Monthly of sales data of a quatre, a month, six months or this year or of a period of your choice.
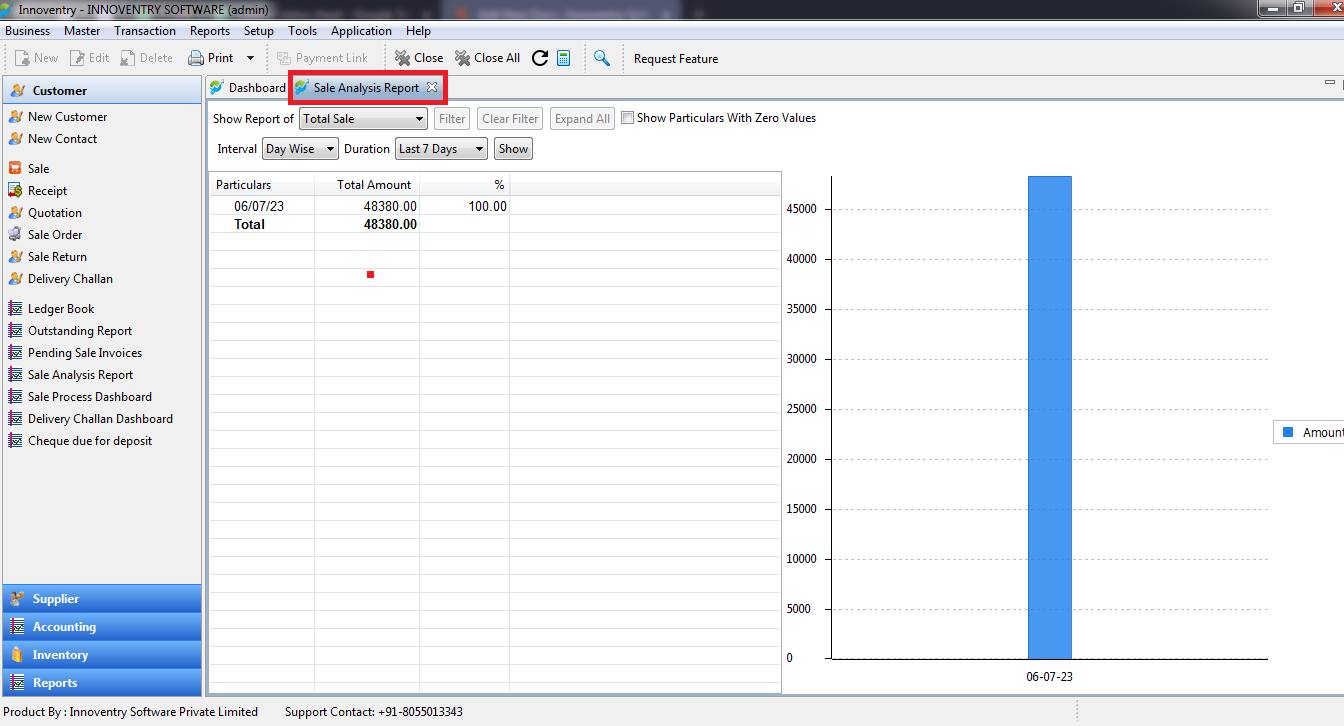
- In this report you can analyze data with help of bar graphs and understand which are the top 5 selling items & which product are least sold in a particular period. You can check the same data Ledger wise (Customer wise), Item Group Wise, Salesman Wise & User Wise as well.
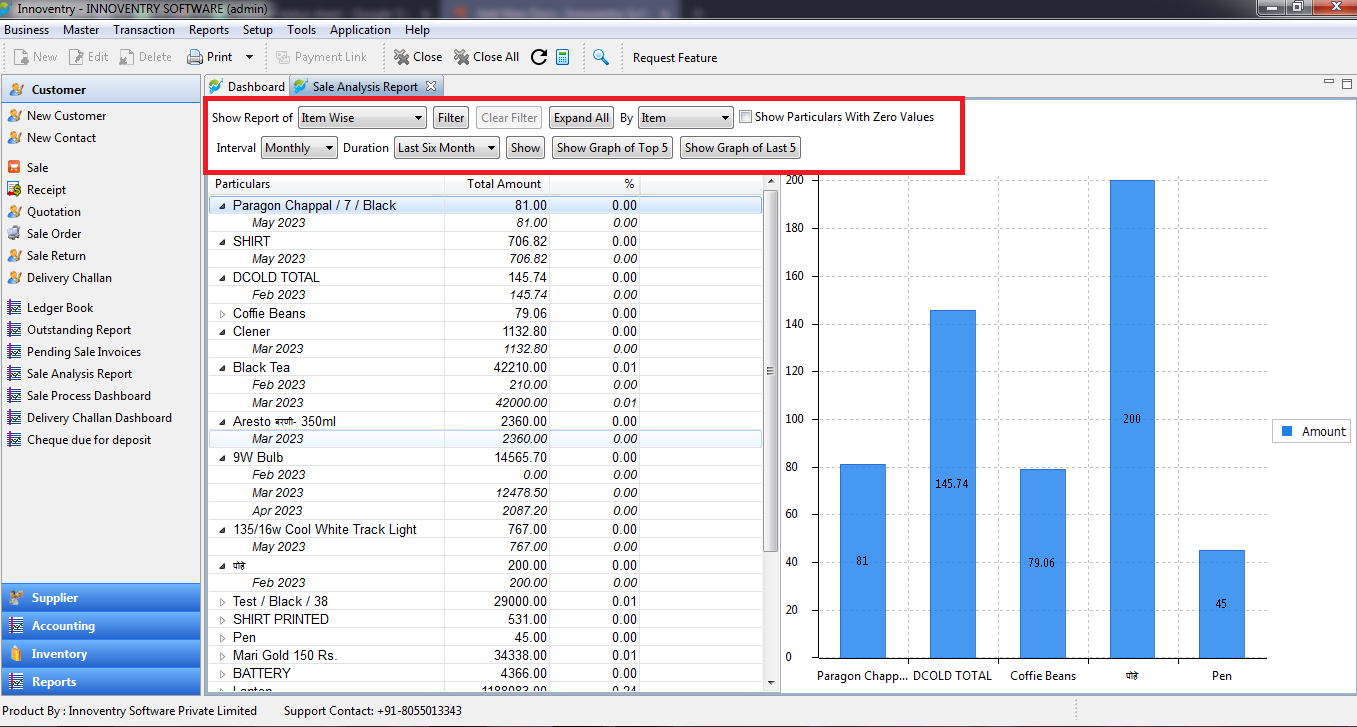
- Using these steps, you can analyze your overall sale and take a best decision & increase a revenue of your business.
For any query, please call on 8055013343 or write to support@innoventry.in


